
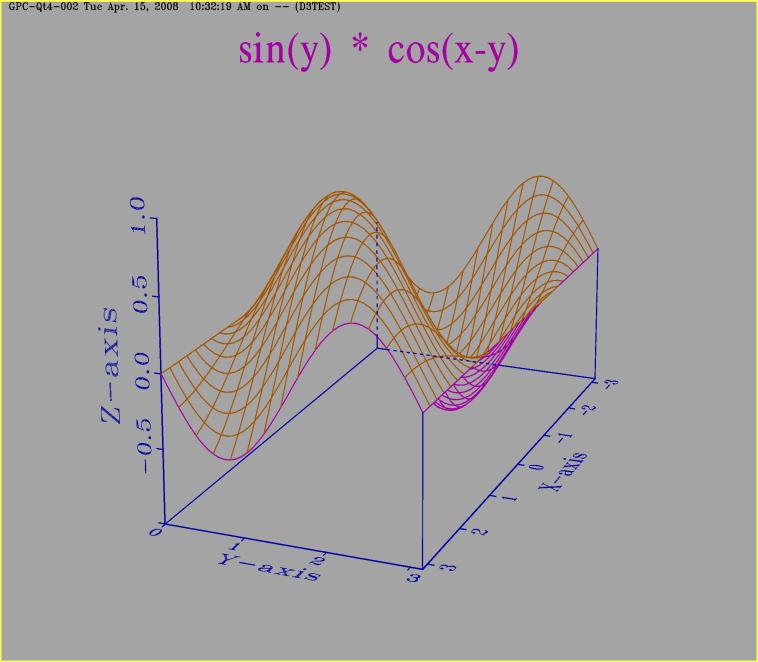
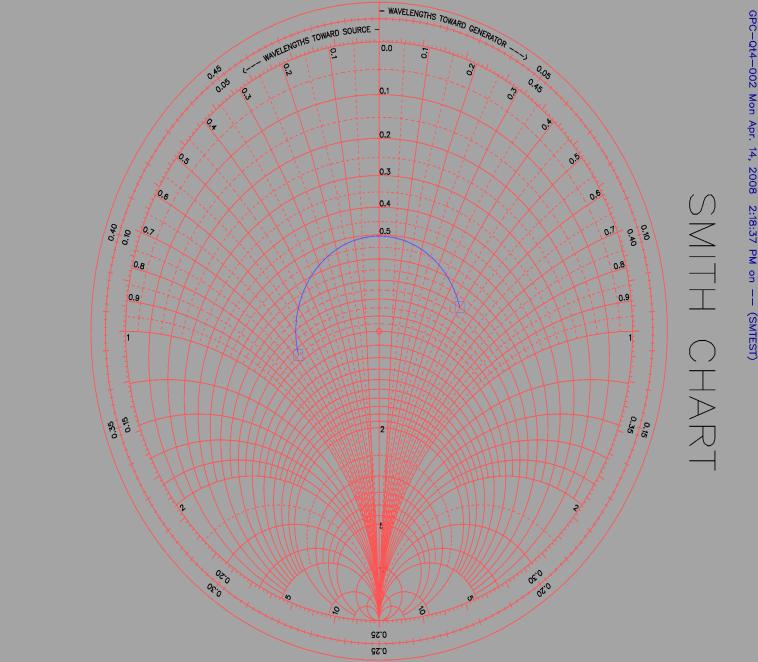
Gpc-Qt is a source library of routines that enable you to generate high quality graphics on either Linux or MS Windows. It is a system for a display of linear x-y plots, linear contour plots, 3-D contours, polar plots, pie charts, error function plots, wedge plots, log-log plots, 3-D surfaces, 3-D bars, bar charts, smith charts, polar contour plots and triangle contour plots. Also a plot of the daemon db of the CPU temperature. It has its own font design system, as of now not yet interactive.
In 1990 I wanted a system to draw astrological charts. I needed something that would draw astrological symbols and draw them in circular fashion. Version 5.0 of this system did that. It ran on DOS. GPC-Qt is a Qt port of that system, with rewrite of the display code.
A graph can be saved as a picture, and be played back anytime by selecting the appropriate menu items.
Included are 4 applications and 27 sample programs. The applications are an astrological program to draw natal charts and transit charts based only on time of birth and geographical position of birth. The latter 2 must be provided by the user. The second application is a set of graphs of stock market funds. It reads the data from a DBIII+ database as provided by FlagShip. The other applications are a system uptime display and a CPU temperature display.
Documentation is included in the distribution file in the form of LaTeX .tex files and in the html subdirectory
as .html files that can be browsed. In order to print the documents LaTeX must be used to format them.
To reproduce the .html files Hyperlatex (http://hyperlatex.sourceforge.net/) must be used to format the .tex files.
There are 3 documents:
api.tex. The browsable file is api.html.
info.tex and info.html .
userguide.tex and userguide.html .
/*#define Q_TNC */ /* Indicates usage of Qt Non-Commercial Windows version */
qmake <path><name>.pro -o <path>Makefile
where <name> is any of the included .pro files and <path> is where GPC-Qt4-002 is installed.
mingw32-make -C <path to GPC-Qt4-002>
Adjustments of the frame and client area for different versions + windowmanagers.
Note: this only has been tried on Windows-XP, Fvwm and KDE.
It seems that only Windows gets it right the first time. Parameters refer to
entries in application.ini. Can be changed with an editor or with the Adj button.
Before playing with these parms, try it as is first.
|
Affecting | Variable | 3.1.1-Emb. | 3.1.1-x11 | 3.0.5-x11 | 2.3.0-NC | 2.3.1-x11 | 1.45-x11 | |||
|
Window Mgr | . | . | Fvwm | KDE2 | KDE3 | Win | Fvwm | KDE2 | Fvwm | KDE2 |
| Frame | desktop_x_off | 0 | 7 | 0 | 0 | 7 | 7 | 0 | 7 | 0 |
| . | desktop_y_off | 0 | 31 | 0 | 0 | 31 | 31 | 0 | 31 | 0 |
| . | width_diff | 8 | 12 | 8 | 40 | 12 | 12 | 8 | 12 | 8 |
| . | client_height_diff | 28 | 35 | 29 | 30 | 35 | 35 | 29 | 35 | 28 |
| client-area | fs_view_height_diff | 80 | 96 | 96 | 108 | 112 | 96 | 96 | 96 | 96 |
| . | nl_view_height_diff | 53 | 52 | 52 | 72 | 80 | 52 | 52 | 52 | 67 |
| Font | main_window_font | h* | h* | h* | h* | h* | h* | h* | h* | h* |
| . | font_point_size | 12 | 12 | 12 | 12 | 112 | 12 | 12 | 12 | 12 |
| . | font_weight | 55 | 55 | 55 | 60 | 112 | 55 | 55 | 55 | 55 |
Each application has a main, which sets up 2 parameter arrays. A global and a local one. These are large files called application.ini and <application>.ini A large amount of the parameters are needed. Many are historical. Then it sets up the application window object. This sets up an application window and paints the "user-code" inside of it. All user code is a function called gpc_main. It contains any number of gpc-qt calls in a specific order. Gpc-qt was not designed with OOP and is in principle not reusable code. Qt on the other hand assumes that all usercode IS reusable (or repaintable). So occasionally there are problems. The worst of these are sudden segfaults if you put something in the wrong place or not do something necessary. To enable multiple plots a variable called "next" is used. First plot is painted when "next" is 0, and so on. Each sample has an "About" with it that summarizes what this thing does.
Each application has its own paramers. (E.g aa = aa.ini)
In there you can select tracing parameters:
Debug now selects with "trace_<0-x>" in local vars.
trace_<0..> that is set
and trace its description when it matches GivenName.
gpcmain_<next> as a float it will collect elapsed time for each plot
and use it on subsequent runs to paint the progressbar.
After executing the gpc-qt program the user sees a blank main window. Hit PF2 or select (Re)Draw in File to start it. The size of the main window depends on what "maxw" and "maxh" are set at in application.ini. The viewport depends on what "vox" "voy" "viw" and "vih" are set at. All of these can be changed with the Adjustment menu.
app_ftype_<x> for the application app_appname_<x>, where the selected filename is
to be entered in the variable name set in app_select_<x>.
The applicaction then reads the latter to use it for drawing. Check out fonttable and do_sysup.
next_no_<x> variable in the applications .ini file. Cf. rates, clrtests, do_sysup, etc.
	QString _t_ = "xxxxxx.xxx";
	set_desc(_t_,get_var_x("app_debug"));
i.e. the description part of the app_debug parm. Then Debug opens up a window that displays the contents of xxxxxx.xxx. You write to this with:
	TDebug    		samp;
	...
        char name[32]="gpc_main";
	...
	samp.Debug(name,">>**Started... %s","\n");
You can write anything to this file, but the display is read-only.
Hitting Debug again turns the window off.
F11 is a "fullscreen" key. You hit it and the mainwindow fills your screen. Hitting it again returns the display to the size it was at before F11 was hit. This is remembered across sessions, so you can remain in F11 mode on repeated invocations.
Take an example that is closest to what you want to do and fiddle with it.
This is a mix of code going back to DOS over 10 or more years. That code was non OOP. Specifically when switching between root/non-root the code will segfault when trying to write to the .tkf and .OFF files. Delete those first!
Following was changed from Gpc-Qt4-002-2:
tmpnam((char *)tmpnamesq[i]);
to
mkstemp((char *)tmpnamesq[i]);
to avoid a link warning.
Time to exec is on a 3000MHz box with 13GB RAM and a GeForce 8400 GS videocard.
|
Name | Exec | Function | Last |
| - | (secs) | - | exec |
|
aa | 31 | Astrological program. Draws natal + transit charts. | 03/02/11-14:57:14 |
| . | 56 | 03/12/07-08:30:14 | |
| astrosyms | 30 | Draws explanation of astrological symbols in Spanish. | 05/02/11-10:10:51 |
| bar | 52 | Draws bar chart with legend. Shows duration warning message. | 05/02/11-10:12:59 |
| bar3d | 10 | Draws 3d bars. | 05/02/11-10:13:51 |
| bess | 11 | 2-D projection within a grid. | 05/02/11-10:16:38 |
| clrtest | 3 | Semi-log plots. 3 plots. | 05/02/11-10:23:56 |
| . | 4 | 05/02/11-10:24:05 | |
| . | 3 | 05/02/11-10:23:40 | |
| cnttest | 3 | Contour plot. | 05/02/11-11:15:25 |
| d2test | 19 | Draws 4 plots on one page. | 05/02/11-11:19:26 |
| d3test | 7 | Plots 3-D surfaces. 2 plots. | 05/02/11-10:00:29 |
| . | 9 | 05/02/11-10:00:07 | |
| delays | 60 | Plots a non-linear polar grid plot from a datafile. | 05/02/11-10:02:51 |
| do_linestyles | 11 | Plots the line styles that can be selected. | 05/02/11-10:06:00 |
| do_sysup | 15 | Plots system uptimes by month or total from DB. | 05/02/11-11:56:54 |
| . | 45 | 05/02/11-11:25:45 | |
| do_test_gpc | 74 | Lists all disk partitions and their usage. | 05/02/11-11:32:58 |
| erftest | 1 | Plots a single curve on an error function grid. | 05/02/11-11:38:15 |
| exh | 9 | Plots the E by H vectors on the Z axis. | 05/02/11-11:40:26 |
| filltest | 12 | Example of using surmat() to draw 3-D surfaces. | 05/02/11-11:42:44 |
| . | 92 | 05/02/11-11:44:21 | |
| fnttest1 | 21 | Plots a sample of many fonts. | 05/02/11-11:49:51 |
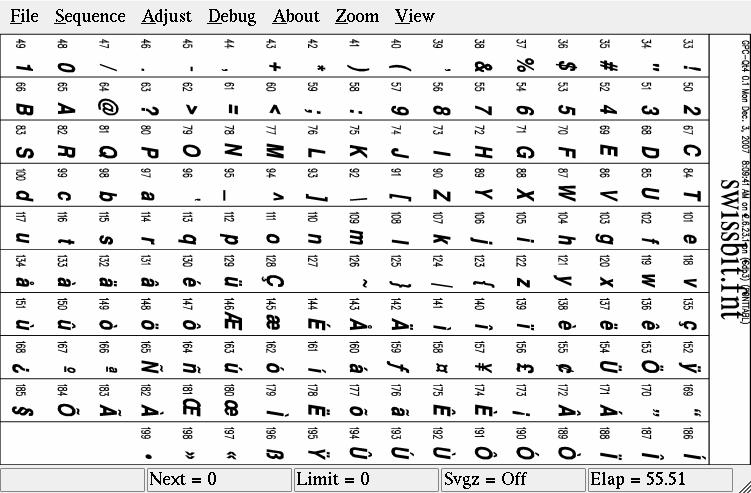
| fonttabl | 5 | Plots a font with all ascii characters. Select from File-Open. | 05/02/11-11:52:30 |
| funds | 24 | Database extraction. 5 mutual fund plots. Last one contour. | 05/02/11-11:54:46 |
| . | 20 | 05/02/11-11:58:05 | |
| . | 21 | 05/02/11-11:58:32 | |
| . | 22 | 05/02/11-11:59:03 | |
| . | 829 | 30/11/07-05:55:55 | |
| jcont | 16 | Proton tokamak orbit plot. | 05/02/11-12:01:11 |
| logtest | 5 | Semi-log and log-log plot. 2 plots. | 05/02/11-12:03:07 |
| . | 8 | 05/02/11-12:03:19 | |
| modtempdisp | 30 | Multiplot of CPU temos from DB. | 05/02/11-12:10:27 |
| . | 22 | 05/02/11-12:11:12 | |
| pat16 | 6 | Plots patterns 1-16 and GPC colors 200-447 | 05/02/11-12:13:48 |
| pattern | 6 | Plots 16 IBM colors + 16 pats + colors 50-174 | 05/02/11-12:28:24 |
| pie | 26 | Plots a pie chart. | 05/02/11-12:30:21 |
| poltest | 4 | Plots 2 polar plots. | 05/02/11-12:32:10 |
| . | 4 | 05/02/11-12:32:01 | |
| r3test | 13 | Plots 3-D surface and contour map of random points. 2 plots. | 05/02/11-12:34:08 |
| . | 4 | 05/02/11-12:34:19 | |
| rates | 7 | Plots airport arrivals. 3 plots. Boxplot + 2 contours. Warning. | 05/02/11-12:36:23 |
| . | 356 | 05/02/11-12:42:23 | |
| . | 276 | 05/02/11-12:47:32 | |
| sample | 14 | Simple sample x-y plot. | 05/02/11-12:52:42 |
| smtest | 3 | 05/02/11-12:54:28 | |
| vfield | 10 | Vector field plot. | 05/02/11-13:00:45 |
gpc-qt at users dot sourceforge dot net
A B C D E F G H I J K L M N O P Q R S T U V W X Y Z
Hugo M. Van Woerkom, April 5, 2013 (HyperLatex - 3.8.1-nodeb-amd64 on /HDB6.boot/vmlinuz-3.8.1-nodeb-amd64(HDB6))